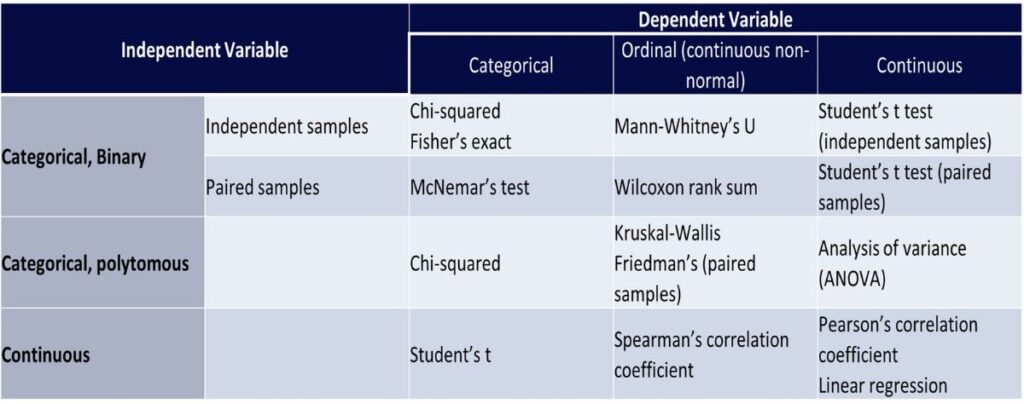
You don’t need a PhD in statistics to choose the right test.
You need a lens—a mental checklist—that helps you zoom in on the right method without spiraling down a stats rabbit hole.
Most early-career researchers overcomplicate this step.
But when you understand the fundamentals, the right test usually picks itself.
Here’s the 4-step system I teach all my mentees 👇

Table. A simple 4-step framework for choosing the right statistical test (every time).
1️⃣ Know Your Data Type
All variables fall into one of these buckets:
→ Categorical (qualitative): Think “groups.”
- Example: Smoker vs. non-smoker, Yes/No for hypertension, Blood type (A/B/AB/O).
You can count how many people fall into each category, but you cannot meaningfully calculate averages.
→ Ordinal: Groups with a rank—but unclear spacing.
- Example: Cancer Stage I–IV, NYHA heart failure classes, Likert scales (e.g., satisfaction levels).
Even though you can rank these, calculating a “mean stage” or “average satisfaction” doesn’t make mathematical sense unless you’re very careful.
→ Continuous (quantitative): True measurements.
- Example: Age, BMI, systolic BP, fasting glucose.
Don’t force a continuous variable into categories unless there’s a strong clinical reason (e.g., BMI ≥30 = obese). It wastes precious data.
2️⃣ Know Your Study Design: How Many Groups Are You Comparing?
This narrows your test options fast.
→ One group (single sample):
Example:
You’re studying a sample of 60 hypertensive patients in your clinic.
You want to know:
Is their average systolic BP significantly different from the national guideline of 130 mmHg?
- Use a one-sample t-test (if data are normal)
- Or a sign test / Wilcoxon signed-rank (if data are skewed)
→ Two groups (independent):
Example 1:
You compare HbA1c levels between patients receiving Drug A vs. Drug B.
- Use independent samples t-test (if normally distributed)
- Or Mann-Whitney U test (if not)
Example 2:
You compare the proportion of flu infections between vaccinated and unvaccinated groups.
- Use Chi-square test (if all expected counts > 5)
- Use Fisher’s Exact test (if expected cell sizes are small)
→ Two groups (paired):
Example 1:
You measured blood pressure before and after starting amlodipine in the same patients.
- Use paired t-test (if differences are normally distributed)
- Or Wilcoxon signed-rank test (if not)
Example 2:
You assessed stress scores before and after mindfulness training in each participant.
- Same logic: paired tests because the observations are linked within-person.
→ Three or more groups:
Example:
You’re testing 3 antihypertensive strategies:
- Group A: lifestyle only
- Group B: lifestyle + ACE inhibitor
- Group C: lifestyle + ARB
You want to compare mean SBP after 6 months.
- Use ANOVA (if normal & equal variances)
- Use Kruskal-Wallis test (if not)
Remember: ANOVA tells you if there’s any difference.
If it’s significant, you need post-hoc tests (like Tukey) to pinpoint which groups differ.
3️⃣ Check Your Assumptions
(Otherwise, you’re just plugging numbers into the wrong formula.)
Before doing any actual analysis, you need to explore your data and should know it inside out.
Ask:
→ Is the data normally distributed?
If yes, use parametric tests (e.g., t-test, ANOVA).
If not, go non-parametric (e.g., Mann-Whitney U, Kruskal-Wallis).
Example (normal):
You’re comparing cholesterol levels between two treatment groups. The histograms look symmetric. Proceed with t-tests or ANOVA.
Example (non-normal):
You’re analyzing length of hospital stay—most patients stay 3–4 days, but some stay 30+. Right-skewed. Use non-parametric tests like Mann-Whitney or Kruskal-Wallis.
→ Do groups have similar spread or variance?
If not, use Welch’s t-test instead of a standard t-test.
Example:
Group A’s standard deviation is 5.
Group B’s is 22.
This is a red flag. Consider using Welch’s t-test, which doesn’t assume equal variances.
→ Are your observations independent?
Each observation must not be influenced by another—unless you’re explicitly doing a paired or clustered design.
Example (independent):
Comparing cholesterol levels in two separate groups of patients.
Example (non-independent):
Patients are nested within the same clinic, and clinic practice style may influence outcomes. You may need to adjust for clustering or use multilevel models.
4️⃣ Define Your Purpose
(Put on your thinking CAP)
C – Comparison
You want to test differences between groups.
Example 1:
Compare average BMI between smokers and non-smokers → t-test
Example 2:
Compare % of patients with controlled BP in 3 clinics → Chi-square
A – Association
You want to know if two variables move together.
Example 1:
Do older patients tend to have higher systolic BP?
→ Use Pearson correlation (if linear & normal)
→ Use Spearman’s rho (if not)
Example 2:
Does cancer stage (ordinal) associate with patient-reported pain level (ordinal)?
→ Use Spearman correlation
P – Prediction
You want to model an outcome based on one or more predictors.
Example 1 (Logistic Regression):
Predict diabetes status (yes/no) using age, BMI, and exercise level.
Example 2 (Cox Regression):
Predict time to death in cancer patients based on stage, treatment, and biomarkers.
Example 3 (Poisson/Negative Binomial):
Model number of asthma attacks per year based on smoking status and medication adherence.
Final Thoughts
Most desk rejections start in the Methods section.
Choosing the wrong test signals weak study design—even if your data is gold.
But once you walk through this 4-step lens, the right test usually becomes obvious:
- What kind of data are you working with?
- How many groups are you comparing?
- Do your data meet the assumptions?
- What’s the goal—Comparison, Association, or Prediction?
Once you answer these, the test practically chooses itself.
