

You’re probably using the wrong regression model—and you don’t even know it.
Most researchers are taught how to run regression models.
But very few are taught how to think about them.
Let’s change that.
No statistical jargons.
No math-heavy lectures.
Just clear explanations, real-world clinical examples, and code you can actually run in Stata or R.
Step 1 — Always Start with “Why” You’re Doing the Test
Before touching software, ask yourself: What am I trying to do here?
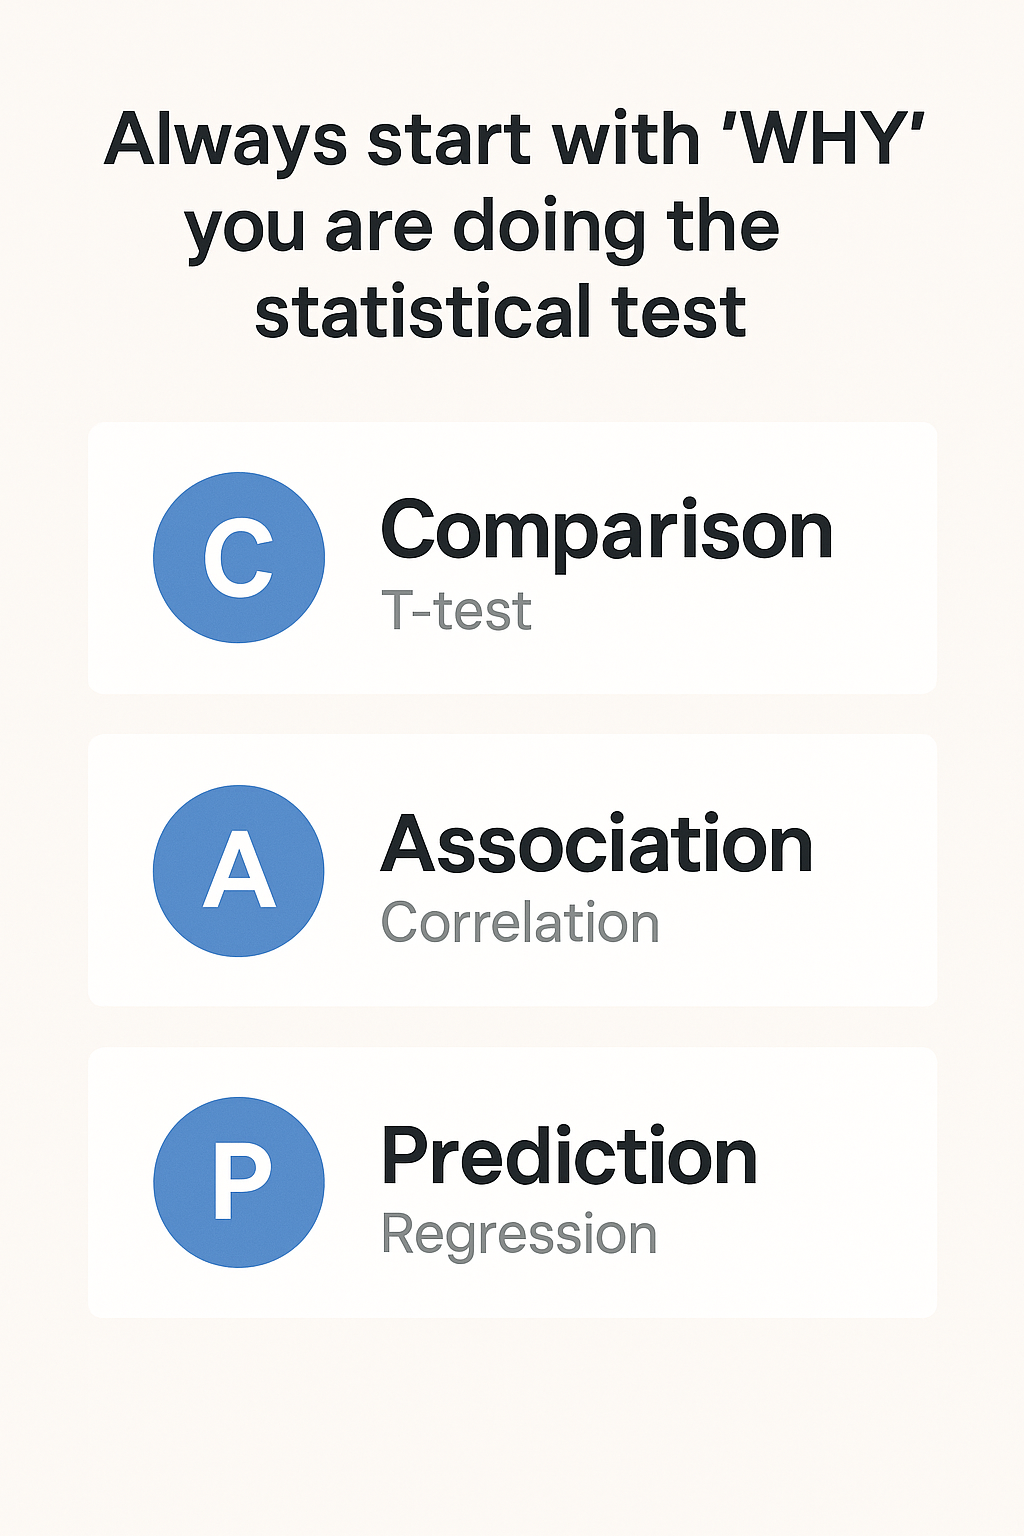
I use the “CAP” shortcut:
- Comparison → e.g., compare mean blood pressure between men and women (T-test)
- Association → e.g., see if BMI is correlated with LDL (Correlation)
- Prediction → e.g., predict A1c from BMI, age, and medication use (Regression)
If your aim is prediction, keep reading…
If not, pause and rethink your method.
Step 2 — What Regression Actually Does
At its core, regression answers:
How does the average value of my outcome change when one or more predictors change?
It’s your statistical lens to quantify relationships.
- Blood pressure and BMI
- Readmission and chronic kidney disease (CKD)
- Hypoglycemia and insulin use
But not all regression is the same. Your outcome type drives the model choice.
Step 3 — Match Your Outcome to the Right Model
| Outcome Type | Regression Model | Example Outcome |
|---|---|---|
| Continuous | Linear | Systolic BP, LDL, HbA1c |
| Binary (Yes/No) | Logistic | 30-day readmission, myocardial infarction |
| Ordered categories | Ordinal logistic | Hypertension stage, NYHA class |
| Unordered categories | Multinomial logistic | Antihypertensive medication type |
| Count | Poisson / Neg. Binomial | ER visits, hospital days |
Let’s walk through each—slowly, with examples.
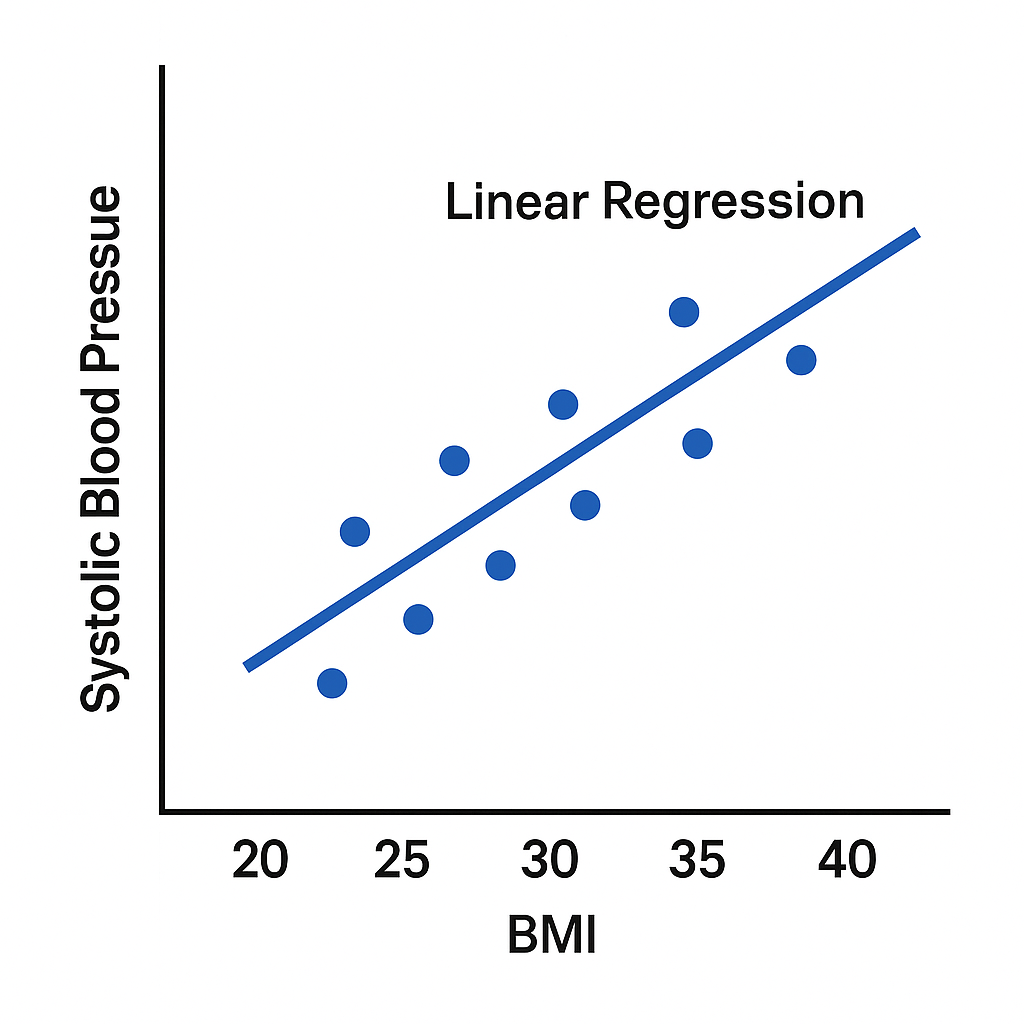
1️⃣ Continuous Outcomes → Linear Regression
When to use: Outcome is a continuous number.
Examples: blood pressure, LDL cholesterol, fasting glucose.
Example question:
Does BMI predict systolic BP in adults with Type 2 diabetes?
- Outcome: SBP (continuous)
- Predictors: BMI, age, sex, antihypertensive use
Stata
reg sbp bmi age i.sex i.med_useR
model <- lm(sbp ~ bmi + age + sex + med_use, data = df)
summary(model)
If BMI coefficient = 1.2 (p < 0.01):
For each 1-unit increase in BMI, SBP increases by 1.2 mmHg on average, adjusting for other variables.
Pro tips:
- Check residual plots to make sure your model fits.
- Use continuous outcomes when possible—turning BP into “high” vs. “normal” throws away information and reduces power.
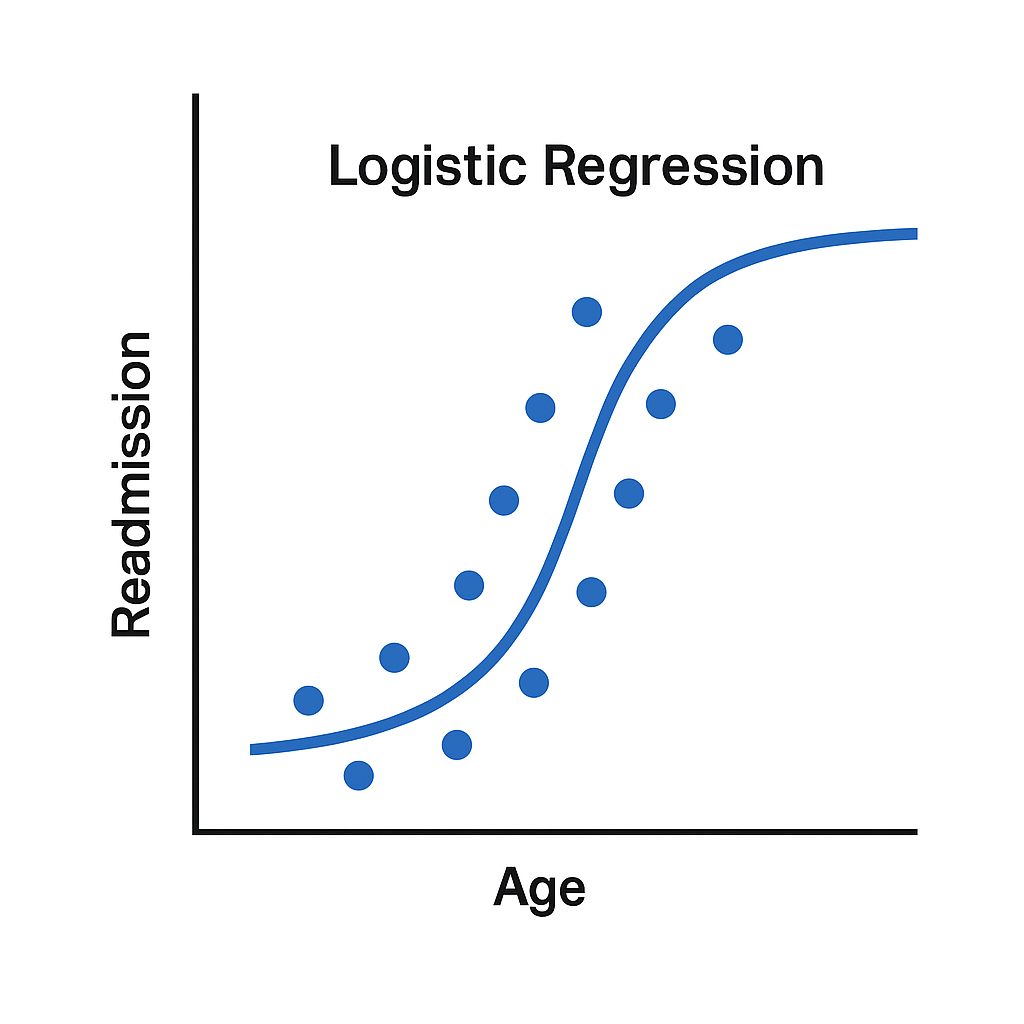
2️⃣ Binary Outcomes → Logistic Regression
When to use: Outcome is yes/no.
Examples: Readmitted within 30 days? Yes/No.
Example question:
What factors predict 30-day readmission after a heart failure hospitalization?
- Outcome: Readmission (yes/no)
- Predictors: age, CKD, length of stay, discharge meds
Stata
logit readmit age i.ckd i.length_stay i.lisinopril
R
model <- glm(readmit ~ age + ckd + length_stay + lisinopril, data = df, family = binomial)
summary(model)
If OR for CKD = 1.8:
Patients with CKD have 80% higher odds of readmission compared to those without CKD.
Watch out:
Odds ratios ≠ risk ratios unless the outcome is rare.
3️⃣ Ordered Categories → Ordinal Logistic Regression
When to use: Outcome has a natural order, but differences between levels aren’t equal.
Examples: Hypertension stage, NYHA heart failure class.
Example question:
What factors predict higher hypertension stage?
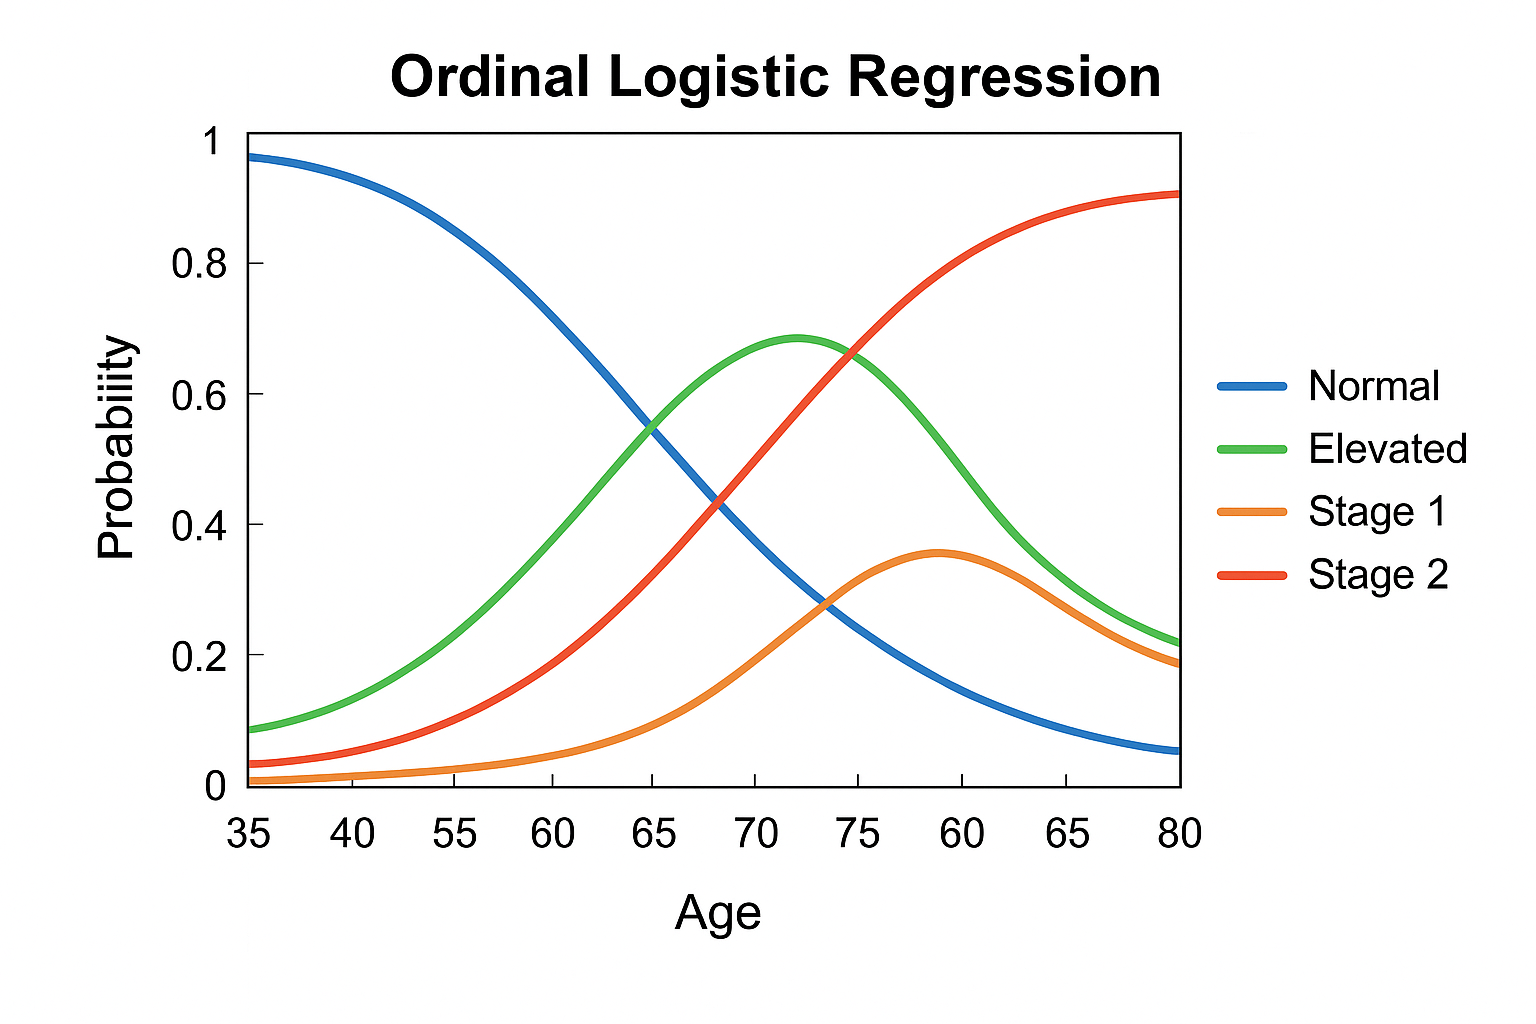
Ordinal logistic regression figure showing how the probability of each BP category (Normal, Elevated, Stage 1, Stage 2) changes with Age.
Stata
ologit htn_stage age bmi activity diabetes
R
library(MASS)
model <- polr(as.factor(htn_stage) ~ age + bmi + activity + diabetes, data = df)
summary(model)
Interpretation: OR = 1.5 means
For every 1-unit increase in BMI, odds of being in a higher BP stage (vs. all lower stages) increase by 50%.
4️⃣ Unordered Categories → Multinomial Logistic Regression
When to use: Outcome has 3+ categories with no natural order.
Example: Medication choice (ACEi, CCB, beta-blocker, diuretic).
Example question:
What predicts initial antihypertensive class prescribed?
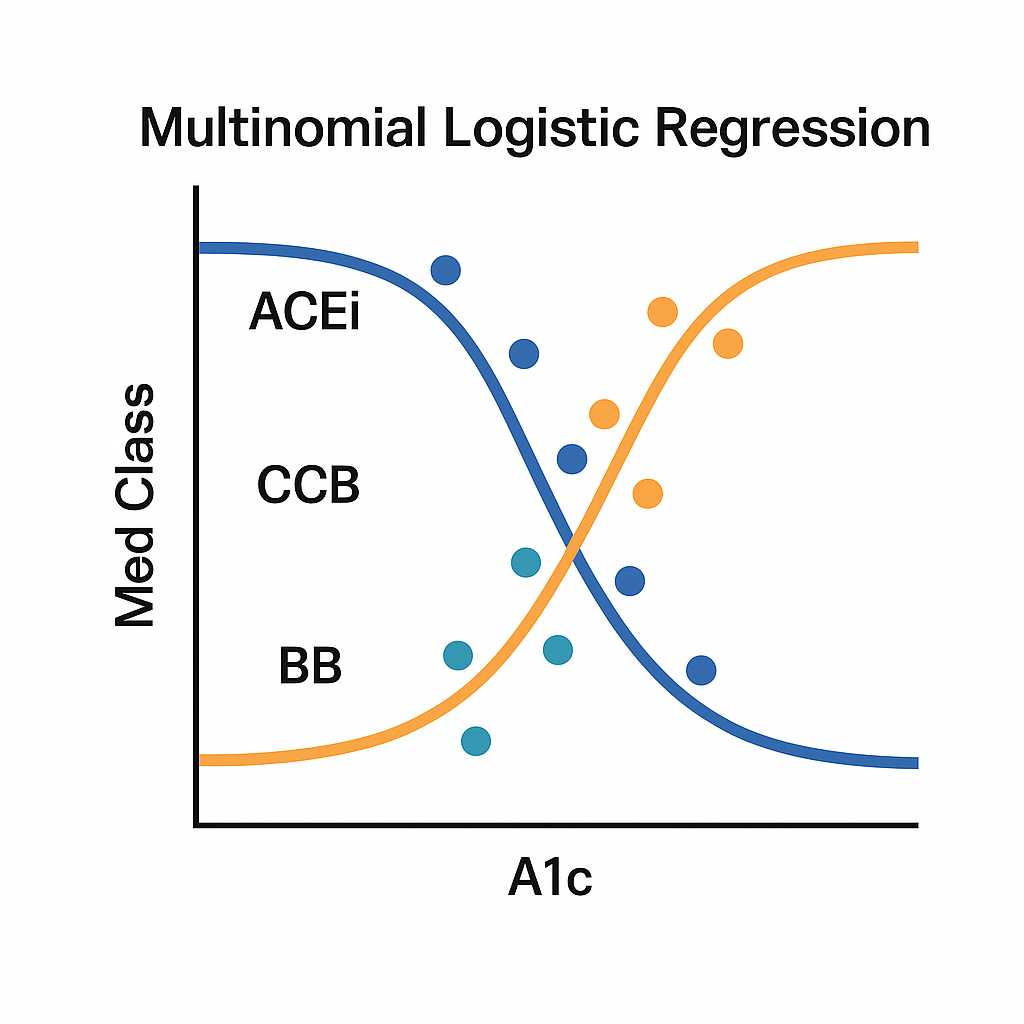
- X-axis (A1c): Predictor variable—here, the patient’s HbA1c level (a measure of blood sugar control).
- Y-axis (Med Class): Outcome variable with three categories:
- ACEi (blue line), CCB (teal line), BB (orange line)
Stata
mlogit med_class age i.race i.ckd i.dm
R
library(nnet)
model <- multinom(med_class ~ age + race + ckd + dm, data = df)
summary(model)
Results tell you odds of choosing each category compared to a reference (often the most common).
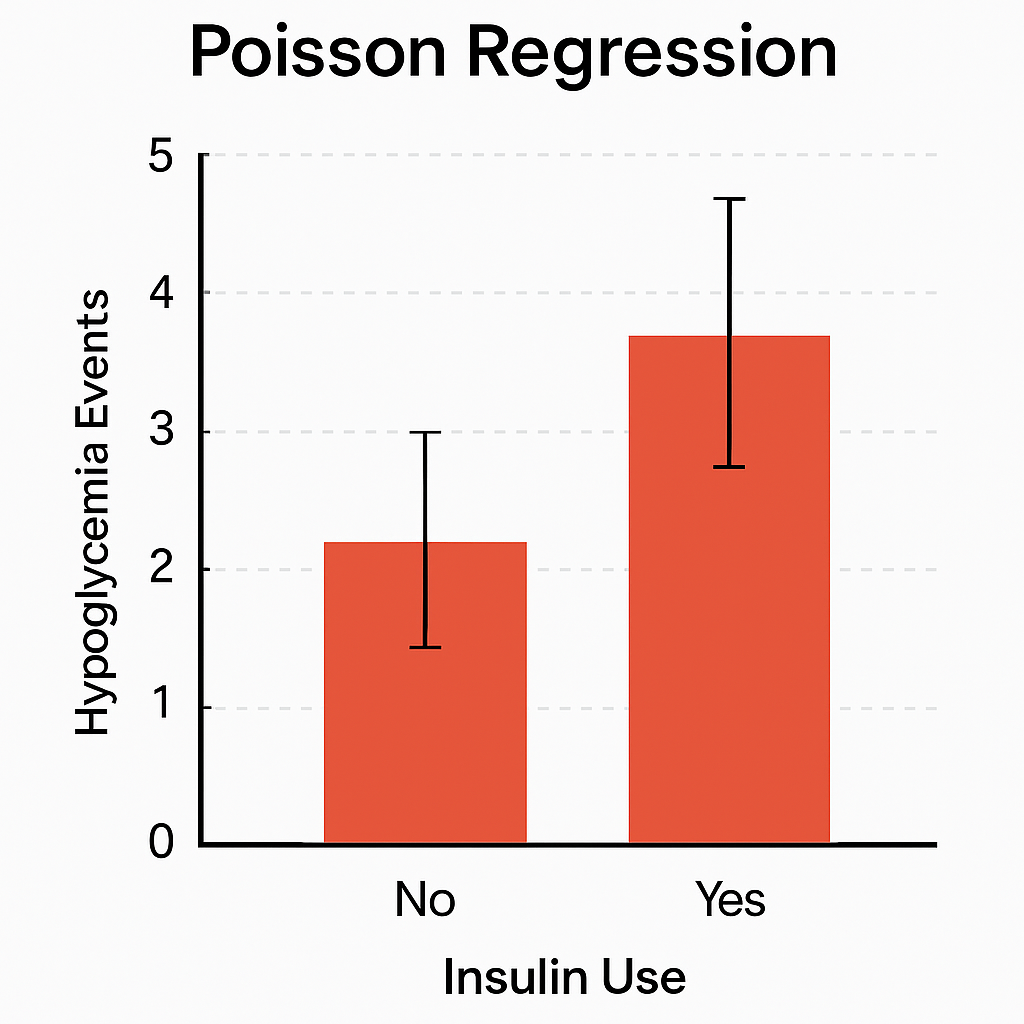
5️⃣ Counts → Poisson or Negative Binomial Regression
When to use: Outcome is a count.
Examples: ER visits, hypoglycemia episodes.
Example question:
Do insulin users have more hypoglycemia events per year?
Stata
poisson hypo_events i.insulin age a1c eGFR
If overdispersion:
nbreg hypo_events i.insulin age a1c eGFR
R
# Poisson
model <- glm(hypo_events ~ insulin + age + a1c + eGFR, family = poisson, data = df)

# Negative binomial
library(MASS)
model <- glm.nb(hypo_events ~ insulin + age + a1c + eGFR, data = df)
If RR = 2.1:
Insulin users have twice the rate of hypoglycemia events per year on average.
Tip: Use negative binomial if variance > mean (common in medical counts).
Step 4 — Avoid These Common Mistakes
- Running linear regression on skewed or categorical outcomes.
- Calling odds ratios “risk” ratios when the outcome is common.
- Only reporting p-values—always include confidence intervals and effect sizes.
- Skipping checks for assumptions (normality, collinearity, model fit).
- Ignoring model diagnostics (AUC for binary, residuals for continuous).
Final Word
Regression isn’t about dumping variables into software.
It’s about matching the model to your question and knowing what the output actually means.
When you get it right, you’re not just producing numbers—you’re producing insights that can guide care, influence policy, and improve patient lives.
And that’s the point.
Which regression model do you feel shaky about?
P.S. If you have been using the free version of ChatGPT (with GPT4o) and never used the reasoning models, I’d recommend you try them out. GPT-5 was just released. You can see how good the answers are- try it here FREE (just note the depth of research questions you get):